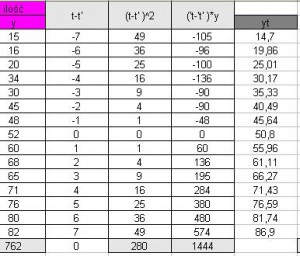
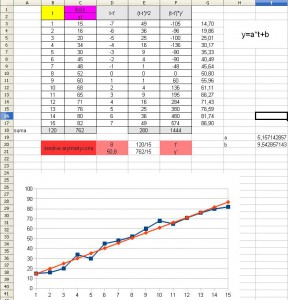
Dzisiaj pokażę jak zrobić w naszym programie funkcję trendu liniowego. Funkcja liniowa przydaje się do wizualnego reprezentowania trendu panującego w naszych zmiennych. Jeśli mamy wiele zmiennych i nie wiemy czy tendencja zmiennych jest spadkowa czy zwyżkowa nasz wykres nam to zilustruje i sami będziemy mogli to ocenić. Na obrazku zamieściłem wizualizacje takiego trendu w excelu:
 Coś o tym trendzie można poczytać tutaj: Trend liniowy [5 stron]
Wersja excelowa: trend_liniowy
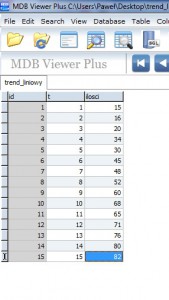
Warto zanim zaczniemy budować sql’a spróbować zrobić sobie taki trend w excelu aby sprawdzić czy wszystko rozumiemy. Tak prosto nie będzie, gdyż nie możemy dodać lokalnej bazy danych w programie visual studio 2012. Baza ta jest typu *.sdf i nie obsługuje „subselect’ów”.Potrzebujemy albo bazy typu *.mdf (baza serwera SQL) albo bazy danych typu *.mdb (baza programu access). Ja użyje bazy danych typu *.mdb. Stworze ją w programie „MDB Plus” dostępnego w dziale „Przydatne programy do vb.net”. Moja baza danych wygląda tak:
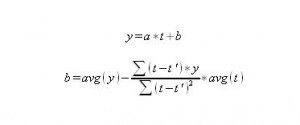
Jeśli ktoś nie wie jak utworzyć bazę danych w programie MDBPlus to zapraszam do działu technicznego. Teraz tak na prawdę musimy wzór na funkcje liniową trochę przekształcić. Najważniejszym elementem jest „a” więc najpierw przekształcimy sobie właśnie to „a”.
W SQL’u będzie to wyglądało tak:
select id,t, ilosci,
((select sum(t*ilosci) as Expr1
from trend_liniowy as trend_liniowy_1)
-
(select avg(t) as Expr1
from trend_liniowy as trend_liniowy_2)
*
(Select sum(ilosci) as Expr1
from trend_liniowy as trend_liniowy_3))
/
((select sum(t^2) as Expr1
from trend_liniowy as trend_liniowy_4)
-
2*(select avg(t) as Expr1
from trend_liniowy as trend_liniowy_5)
*
(select sum(t) as Expr1
from trend_liniowy as trend_liniowy_6)
+
(select max(t) as Expr1
from trend_liniowy as trend_liniowy_7)
*
(select avg(t)^2 as Expr1
from trend_liniowy as trend_liniowy_8))
as tre
from trend_liniowy
group by id,t,ilosci
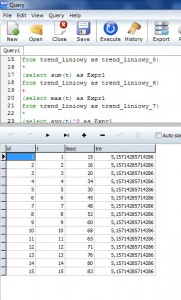
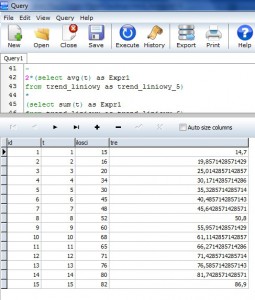
Po wykonaniu zapytania otrzymamy:
Jeśli widzieliście plik excel to tam też a wyszło równe 5,16 teraz już tylko formalność
select id,t, ilosci,
(select avg(ilosci) as Expr1
from trend_liniowy as trend_liniowy_0)
-
((select sum(t*ilosci) as Expr1
from trend_liniowy as trend_liniowy_1)
-
(select avg(t) as Expr1
from trend_liniowy as trend_liniowy_2)
*
(Select sum(ilosci) as Expr1
from trend_liniowy as trend_liniowy_3))
/
((select sum(t^2) as Expr1
from trend_liniowy as trend_liniowy_4)
-
2*(select avg(t) as Expr1
from trend_liniowy as trend_liniowy_5)
*
(select sum(t) as Expr1
from trend_liniowy as trend_liniowy_6)
+
(select max(t) as Expr1
from trend_liniowy as trend_liniowy_7)
*
(select avg(t)^2 as Expr1
from trend_liniowy as trend_liniowy_8))
*
(select avg(t) as Expr1
from trend_liniowy as trend_liniowy_9)
as tre
from trend_liniowy
group by id,t,ilosci
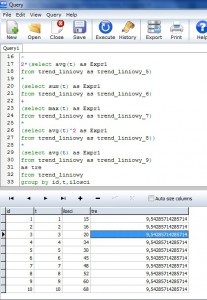
Tak i tutaj wyszło b=9,54
teraz wystarczy tylko to połączyć i otrzymujemy trend liniowy :]
select id,t, ilosci,

((select sum(t*ilosci) as Expr1
from trend_liniowy as trend_liniowy_1)
-
(select avg(t) as Expr1
from trend_liniowy as trend_liniowy_2)
*
(Select sum(ilosci) as Expr1
from trend_liniowy as trend_liniowy_3))
/
((select sum(t^2) as Expr1
from trend_liniowy as trend_liniowy_4)
-
2*(select avg(t) as Expr1
from trend_liniowy as trend_liniowy_5)
*
(select sum(t) as Expr1
from trend_liniowy as trend_liniowy_6)
+
(select max(t) as Expr1
from trend_liniowy as trend_liniowy_7)
*
(select avg(t)^2 as Expr1
from trend_liniowy as trend_liniowy_8))
*t+
(select avg(ilosci) as Expr1
from trend_liniowy as trend_liniowy_0)
-
((select sum(t*ilosci) as Expr1
from trend_liniowy as trend_liniowy_1)
-
(select avg(t) as Expr1
from trend_liniowy as trend_liniowy_2)
*
(Select sum(ilosci) as Expr1
from trend_liniowy as trend_liniowy_3))
/
((select sum(t^2) as Expr1
from trend_liniowy as trend_liniowy_4)
-
2*(select avg(t) as Expr1
from trend_liniowy as trend_liniowy_5)
*
(select sum(t) as Expr1
from trend_liniowy as trend_liniowy_6)
+
(select max(t) as Expr1
from trend_liniowy as trend_liniowy_7)
*
(select avg(t)^2 as Expr1
from trend_liniowy as trend_liniowy_8))
*
(select avg(t) as Expr1
from trend_liniowy as trend_liniowy_9)
as tre
from trend_liniowy
group by id,t,ilosci
Dla porównania Dane z Excela i dane z MdbPlus. Więc Querry mamy z głowy teraz dla tych którzy nie wiedzą jak wykorzystać to w praktyce zrobimy sobie program, podczepimy bazę damych *.mdb i wyświetlimy te dane w oknie wykresu.
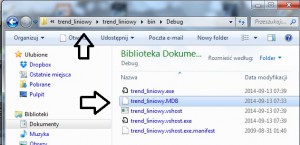
Teraz tworzymy nowy projekt i będziemy montować naszą bazę danych. Gdy przygotujemy już pusty projekt, kopiujemy naszą bazę danych do folderu projektu dokładnie tutaj:
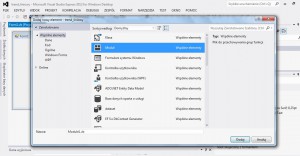
Wracamy do naszego projektu. Musimy dodać moduł robimy to tak:
A po dodaniu po prawej stronie powinien pojawić nam się nowy element modułu:
Teraz tworzymy publiczne połączenie do naszej bazy danych. Wygląda ono tak:
Imports System.Data
Imports System.Data.Odbc
Module Module1
    Public con As New OdbcConnection("Driver={Microsoft Access Driver (*.mdb)};DBQ=|DataDirectory|\trend_liniowy.mdb;")
End Module
Gdzie w DBQ wpisujemy lokalizacje naszej bazy danych i jej nazwę. |DataDirectory| oznacza, że plik znajduje się w folderze z aplikacją. Przechodzimy do naszej formy głównej i tworzymy połączenie:
Public Class Form1
    Private Sub Form1_Load(sender As Object, e As EventArgs) Handles MyBase.Load
        Con.open()
    End Sub
End Class
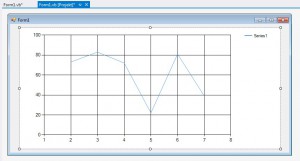
Odpalamy nasz program. Jeśli wszystko jest dobrze powinna pojawić nam się czysta forma. Jeśli wystąpi błąd należy sprawdzić parametry połączenia. Teraz dodajemy do naszej formy wykres („Chart”). Znajdziemy go w „Przyborniku”, przenosimy na naszą formę.
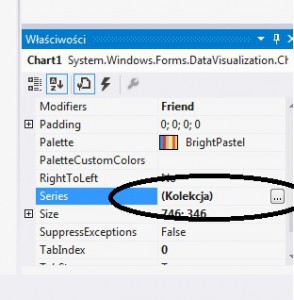
Po prawej stronie znajdujemy we właściwościach naszego wykresu opcje „Series”.
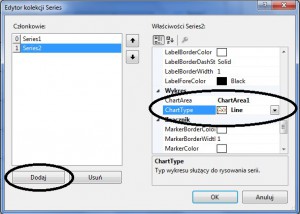
Dodajemy jeszcze jedną serie danych:
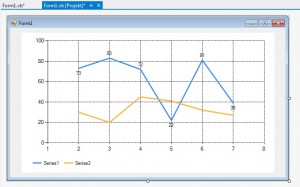
zmieniamy jej typ na „line” jeśli pierwsza seria jest typu „column” warto jej również zmienić typ na „line”. Warto tutaj poeksperymentować z „Seies”, „Legends” i „ChartAreas” aby nasz wykres nabrał trochę zarówno czytelności jak i wyglądu. Po kilku zmianach mój wykres wygląda tak:
Wracamy do naszego kodu i wypełniamy nasz wykres danymi z tabeli. Kod do tego służący wygląda tak:
Imports System.Data.Odbc
Imports System.Windows.Forms.DataVisualization.Charting


Public Class Form1
    Dim cmd As New OdbcCommand
    Dim dat As OdbcDataReader

    Private Sub Form1_Load(sender As Object, e As EventArgs) Handles MyBase.Load
        con.Open()
        Dim querry As String
        querry = "select id,t, ilosci, round(((select sum(t*ilosci) as Expr1 from trend_liniowy as trend_liniowy_1)-(select avg(t) as Expr1 from trend_liniowy as trend_liniowy_2)*(Select sum(ilosci) as Expr1 from trend_liniowy as trend_liniowy_3))/((select sum(t^2) as Expr1 from trend_liniowy as trend_liniowy_4)-2*(select avg(t) as Expr1 from trend_liniowy as trend_liniowy_5)*(select sum(t) as Expr1 from trend_liniowy as trend_liniowy_6)+(select max(t) as Expr1 from trend_liniowy as trend_liniowy_7)*(select avg(t)^2 as Expr1 from trend_liniowy as trend_liniowy_8))*t+(select avg(ilosci) as Expr1 from trend_liniowy as trend_liniowy_0)-((select sum(t*ilosci) as Expr1 from trend_liniowy as trend_liniowy_1)-(select avg(t) as Expr1 from trend_liniowy as trend_liniowy_2)*(Select sum(ilosci) as Expr1 from trend_liniowy as trend_liniowy_3))/((select sum(t^2) as Expr1 from trend_liniowy as trend_liniowy_4)-2*(select avg(t) as Expr1 from trend_liniowy as trend_liniowy_5)*(select sum(t) as Expr1 from trend_liniowy as trend_liniowy_6)+(select max(t) as Expr1 from trend_liniowy as trend_liniowy_7)*(select avg(t)^2 as Expr1 from trend_liniowy as trend_liniowy_8))*(select avg(t) as Expr1 from trend_liniowy as trend_liniowy_9),2) as tre from trend_liniowy group by id,t,ilosci"
        Try
            cmd = New OdbcCommand(querry, con)
            dat = cmd.ExecuteReader

            Dim ds As New DataSet
            Dim oData As New OdbcDataAdapter(querry, con)
            oData.Fill(ds, "Table1")
            Chart1.DataSource = ds.Tables("Table1")

            Dim Series1 As Series = Chart1.Series("Series1")
            Dim Series2 As Series = Chart1.Series("Series2")

            Series1.Name = "Sprzedaż"
            Chart1.Series(Series1.Name).XValueMember = "t"
            Chart1.Series(Series1.Name).YValueMembers = "ilosci"

            Series2.Name = "Trend liniowy"
            Chart1.Series(Series2.Name).XValueMember = "t"
            Chart1.Series(Series2.Name).YValueMembers = "tre"

        Catch ex As Exception
            MsgBox(ex.Message)
        Finally
            cmd.Dispose()
            con.Close()
        End Try
    End Sub
End Class
To by było na tyle. Jeśli ktoś ma jakieś pytania proszę je zostawić w komentarzach albo pisać na maila.
cały program do pobrania: trend_liniowy
